Datei:Gaussianprocess SensorCalibration2Point.svg
Zur Navigation springen
Zur Suche springen

Größe der PNG-Vorschau dieser SVG-Datei: 306 × 230 Pixel. Weitere Auflösungen: 319 × 240 Pixel | 639 × 480 Pixel | 1.022 × 768 Pixel | 1.280 × 962 Pixel | 2.560 × 1.924 Pixel.
Originaldatei (SVG-Datei, Basisgröße: 306 × 230 Pixel, Dateigröße: 28 KB)
Beschreibung
| Beschreibung |
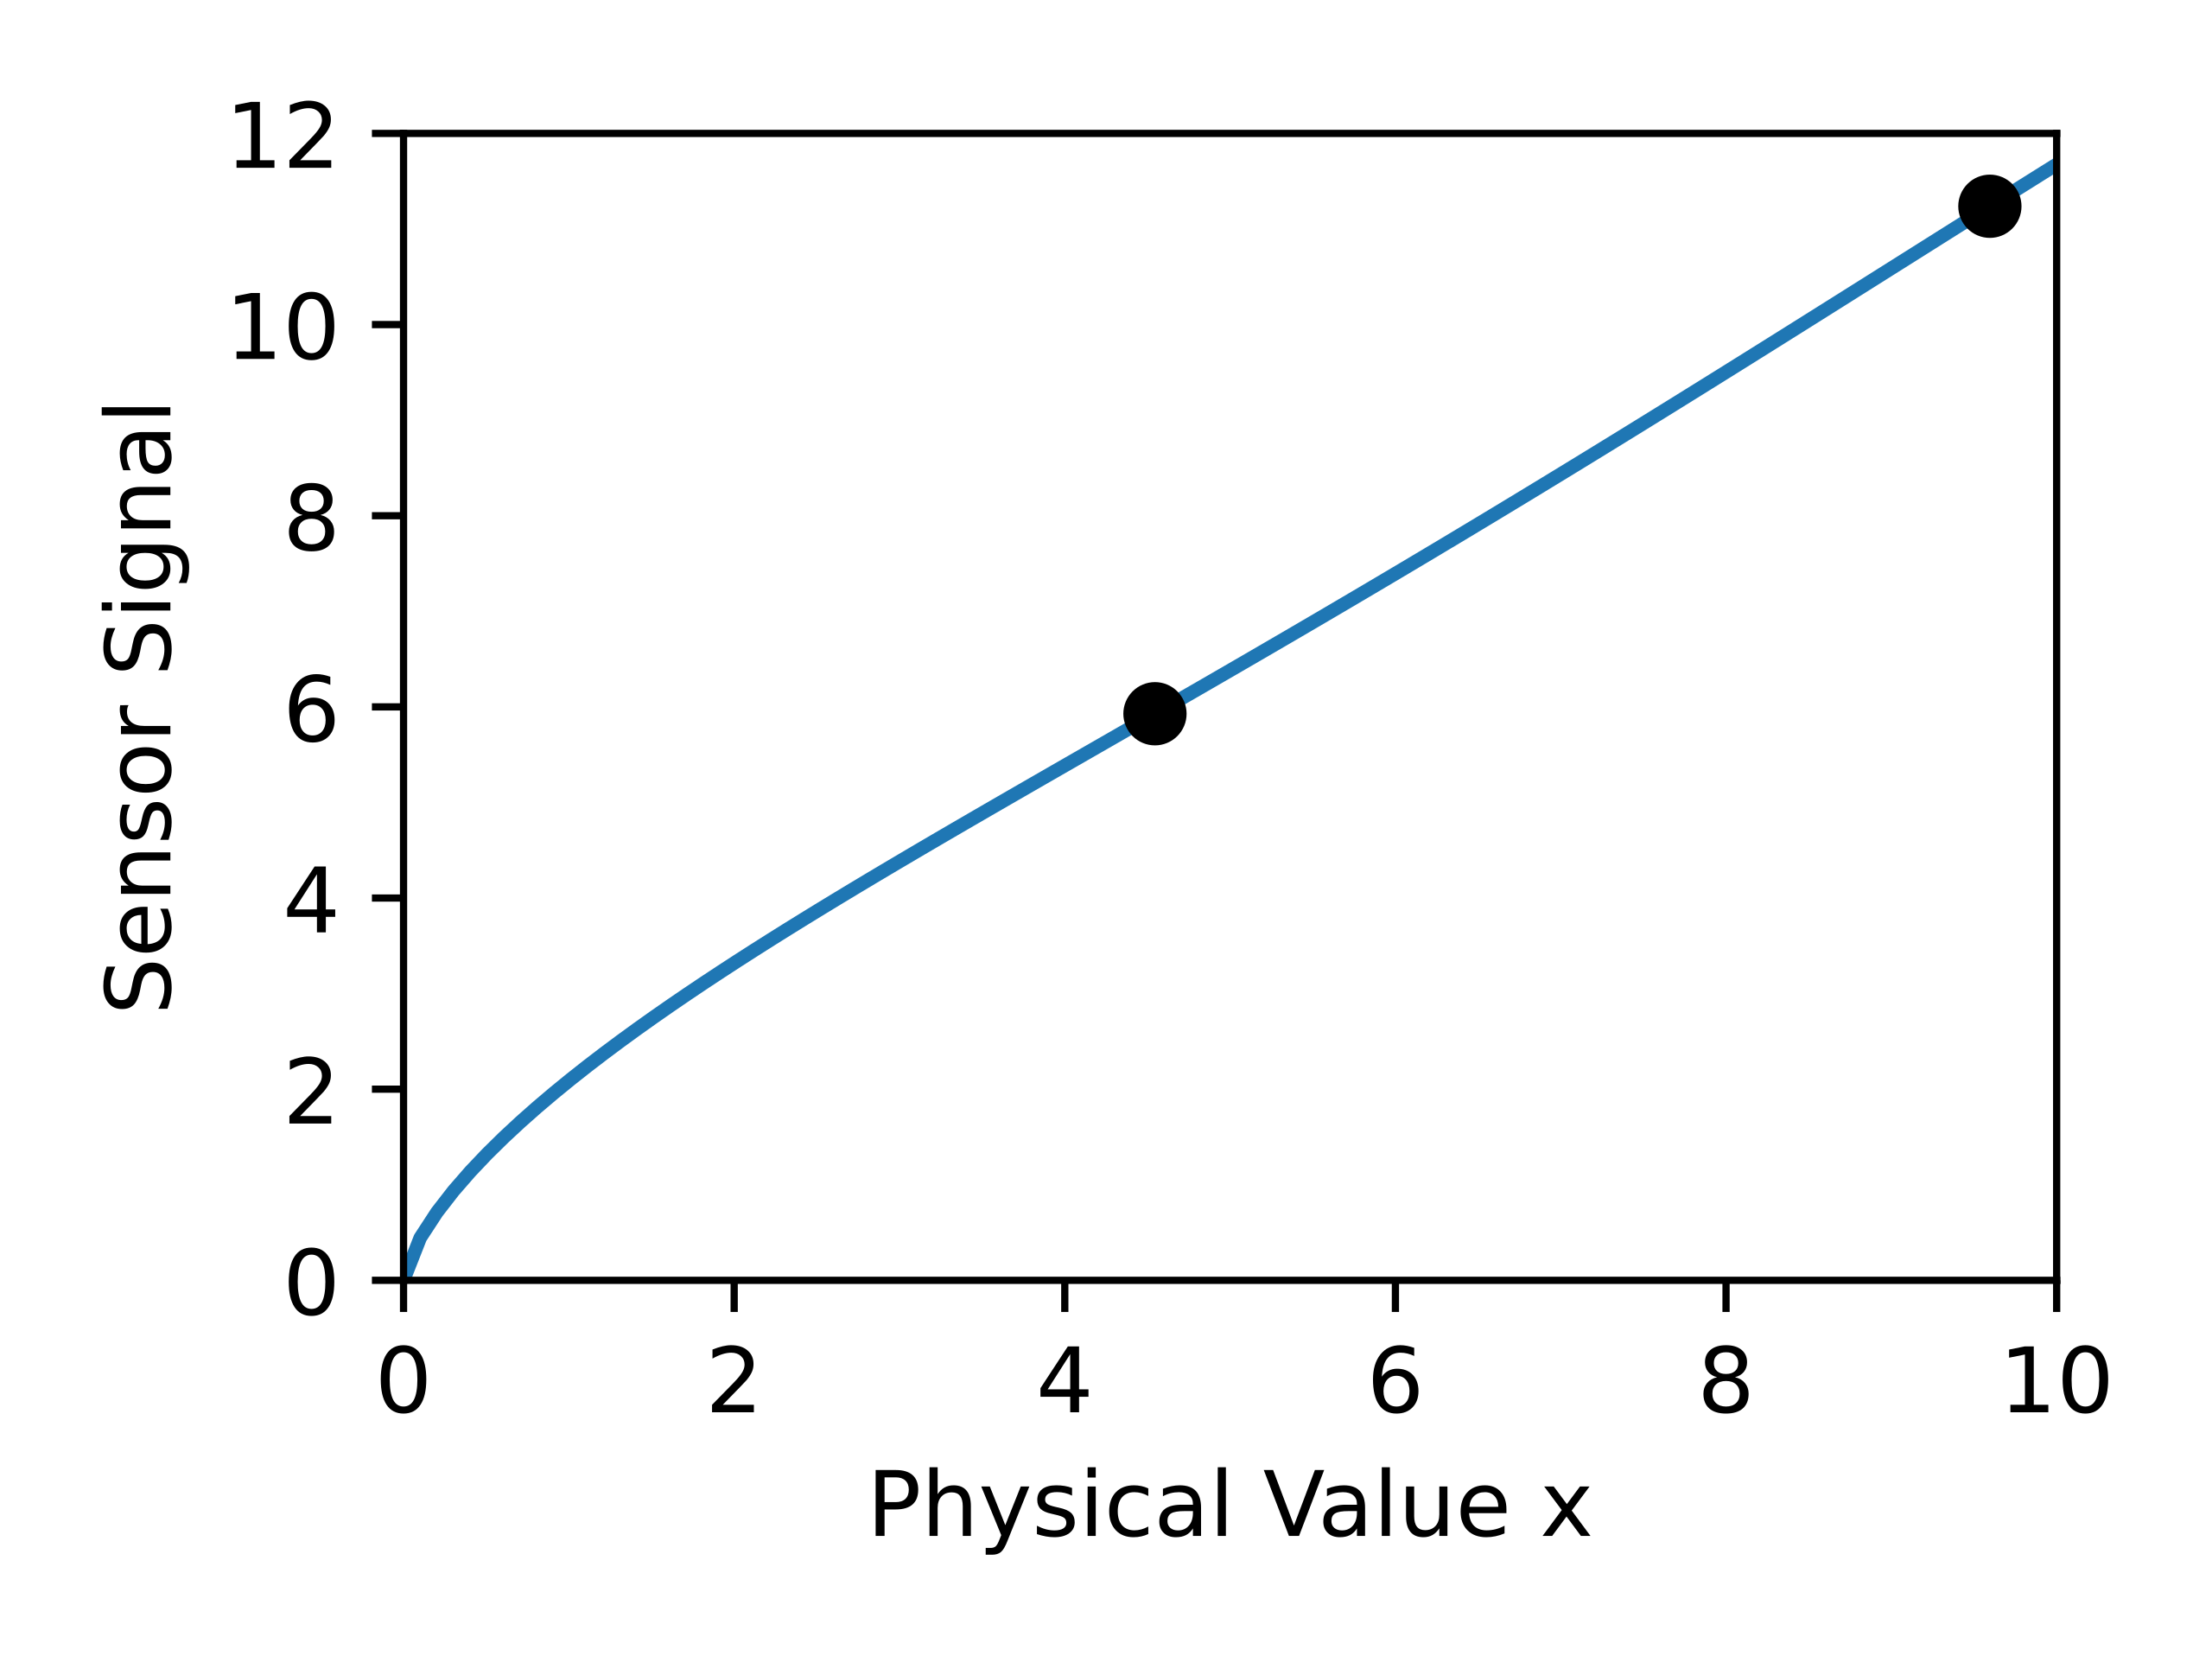
Deutsch: Calibration curve reconstruction with two measurement |
| Datum | |
| Quelle | Eigenes Werk |
| Urheber | Physikinger |
| SVG‑Erstellung | |
| Quelltext | Python code#This source code is public domain
#Author: Christian Schirm
import numpy, scipy.spatial
import matplotlib.pyplot as plt
numpy.random.seed(1)
def covMat(x1, x2, covFunc, noise=0): # Covariance matrix
cov = covFunc(scipy.spatial.distance_matrix(numpy.atleast_2d(x1).T, numpy.atleast_2d(x2).T))
if noise: cov += numpy.diag(numpy.ones(len(cov))*noise)
return cov
N=15
x = numpy.linspace(0, 10, 100)
y = [4*x**.7*(0.3+0.4*numpy.random.rand()) + (numpy.random.rand()-0.5)*2.8*numpy.sin(0.3*x*(1+0.05*numpy.random.rand())) for i in range(N)]
fig = plt.figure(figsize=(4.*0.85,3*0.85),dpi=100)
for i,iy in enumerate(y): plt.plot(x,iy,color=plt.cm.tab10(i*1./N))
plt.xlabel(u'Physical Value x')
plt.ylabel('Sensor Signal')
plt.axis([0,10,0,12])
plt.tight_layout()
plt.savefig('Gaussianprocess_SensorCalibrationCurves.svg')
A = numpy.array(y)
m = numpy.mean(A,axis=0)
cov = (A-m).T.dot((A-m))/(len(A)-1)
sigma = numpy.sqrt(cov.diagonal())
fig = plt.figure(figsize=(4.*0.85,3*0.85),dpi=100)
plt.fill_between(x, m - sigma, m + sigma, color = '0.85')
plt.plot(x,m,'-')
plt.xlabel(u'Physical Value x')
plt.ylabel('Sensor Signal')
plt.axis([0,10,0,12])
plt.tight_layout()
plt.savefig('Gaussianprocess_SensorCalibrationCurvesMean.svg')
iTest = numpy.array([45, 95])
yTest = m[iTest] + [+0.5,+2]
mask = numpy.zeros(len(cov),'bool')
mask[iTest[-1:]] = True
Ckk = cov[mask][:,mask]
Cuu = cov
numpy.fill_diagonal(Cuu,numpy.diag(Cuu)+0.000001)
CkkInv = numpy.linalg.inv(Ckk)
Cuk = cov[:,mask]
yPred = m + numpy.dot(numpy.dot(Cuk,CkkInv), yTest[-1:] - m[mask])
sigma = numpy.sqrt(numpy.maximum(0,numpy.diag(Cuu - numpy.dot(numpy.dot(Cuk,CkkInv),Cuk.T))))
fig = plt.figure(figsize=(4.*0.85,3*0.85),dpi=100)
plt.fill_between(x, yPred - sigma, yPred + sigma, color = '0.85')
plt.plot(x,yPred,'-')
plt.plot(x[mask],yTest[-1:],'ko')
plt.xlabel(u'Physical Value x')
plt.ylabel('Sensor Signal')
plt.axis([0,10,0,12])
plt.tight_layout()
plt.savefig('Gaussianprocess_SensorCalibration1Point.svg')
mask = numpy.zeros(len(cov),'bool')
mask[iTest] = True
Ckk = cov[mask][:,mask]
Cuu = cov
numpy.fill_diagonal(Cuu,numpy.diag(Cuu)+0.000001)
CkkInv = numpy.linalg.inv(Ckk)
Cuk = cov[:][:,mask]
yPred = m + numpy.dot(numpy.dot(Cuk,CkkInv), yTest - m[mask])
sigma = numpy.sqrt(numpy.maximum(0,numpy.diag(Cuu - numpy.dot(numpy.dot(Cuk,CkkInv),Cuk.T))))
fig = plt.figure(figsize=(4.*0.85,3*0.85),dpi=100)
plt.fill_between(x, yPred - sigma, yPred + sigma, color = '0.85')
plt.plot(x,yPred,'-')
plt.plot(x[mask],yTest,'ko')
plt.xlabel(u'Physical Value x')
plt.ylabel('Sensor Signal')
plt.axis([0,10,0,12])
plt.tight_layout()
plt.savefig('Gaussianprocess_SensorCalibration2Point.svg')
|
Lizenz
Ich, der Urheber dieses Werkes, veröffentliche es unter der folgenden Lizenz:
| Diese Datei wird unter der Creative-Commons-Lizenz CC0 1.0 Verzicht auf das Copyright zur Verfügung gestellt. | |
| Die Person, die das Werk mit diesem Dokument verbunden hat, übergibt dieses weltweit der Gemeinfreiheit, indem sie alle Urheberrechte und damit verbundenen weiteren Rechte – im Rahmen der jeweils geltenden gesetzlichen Bestimmungen – aufgibt. Das Werk kann – selbst für kommerzielle Zwecke – kopiert, modifiziert und weiterverteilt werden, ohne hierfür um Erlaubnis bitten zu müssen.
|
Dateiversionen
Klicke auf einen Zeitpunkt, um diese Version zu laden.
| Version vom | Vorschaubild | Maße | Benutzer | Kommentar | |
|---|---|---|---|---|---|
| aktuell | 22:28, 23. Mär. 2023 | | 306 × 230 (28 KB) | wikimediacommons>Physikinger | English |
Dateiverwendung
Die folgende Seite verwendet diese Datei: